- (**)
Spectrum of vowel of constant pitch:
Write an m-file script to accomplish the following tasks:
- Record your utterance of the English letter "e" for 3 seconds, with 16KHz/16Bits/Mono. (Please try to maintain a stable pitch and volume.)
- Use buffer2.m and frame2volume.m to do frame blocking and volume computation, respectively, with frameSize=32ms, overlap=0ms. Please identify the frame with the maximum volume, and the preceding/succeeding 2 frames, to have 5 frames in total.
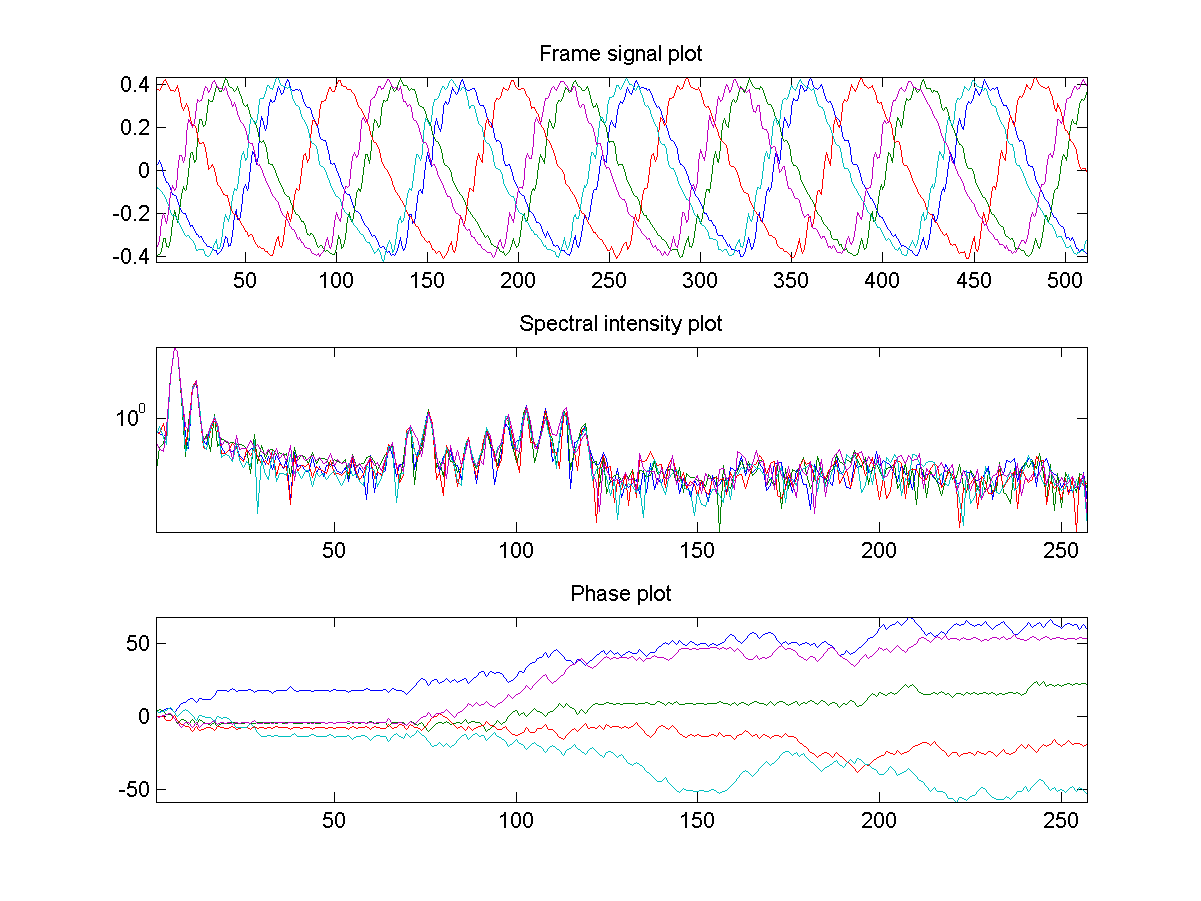
- Use fft to compute the spectrum of these 5 frames and have the following plots:
- subplot(3,1,1): time-domain signals of these 5 frames.
- subplot(3,1,2): one-side magnitude spectra of these 5 frames.
- subplot(3,1,3): one-side phase spectra of these 5 frames.
- Before performing FFT on each frame, you should multiply the frame with the Hamming window to make the harmonics more obvious. The command is "frame=frame.*hamming(length(frame))".
- When you plot the magnitude spectrum, you can use log scale on y-axis. To achieve this, you can simply issue "set(gca, 'yscale', 'log')" after the second plot.
- In order to make the phase a continuous curve, you can use the function unwrap.
- Observe your plots and find which plots are more consistent within 5 frames? (Hint: Since our pronunciation of these 5 frames are the same, the features which are more invariant can be used for speech recognition.)
- (**) Spectrum of vowel of varying pitch: Write an m-file script to repeat the previous exercise, but change the recording to the Mandarin of 「ㄧˊ」. This exercise can be used to observe the variation of spectrum under varying pitch.
- (**)
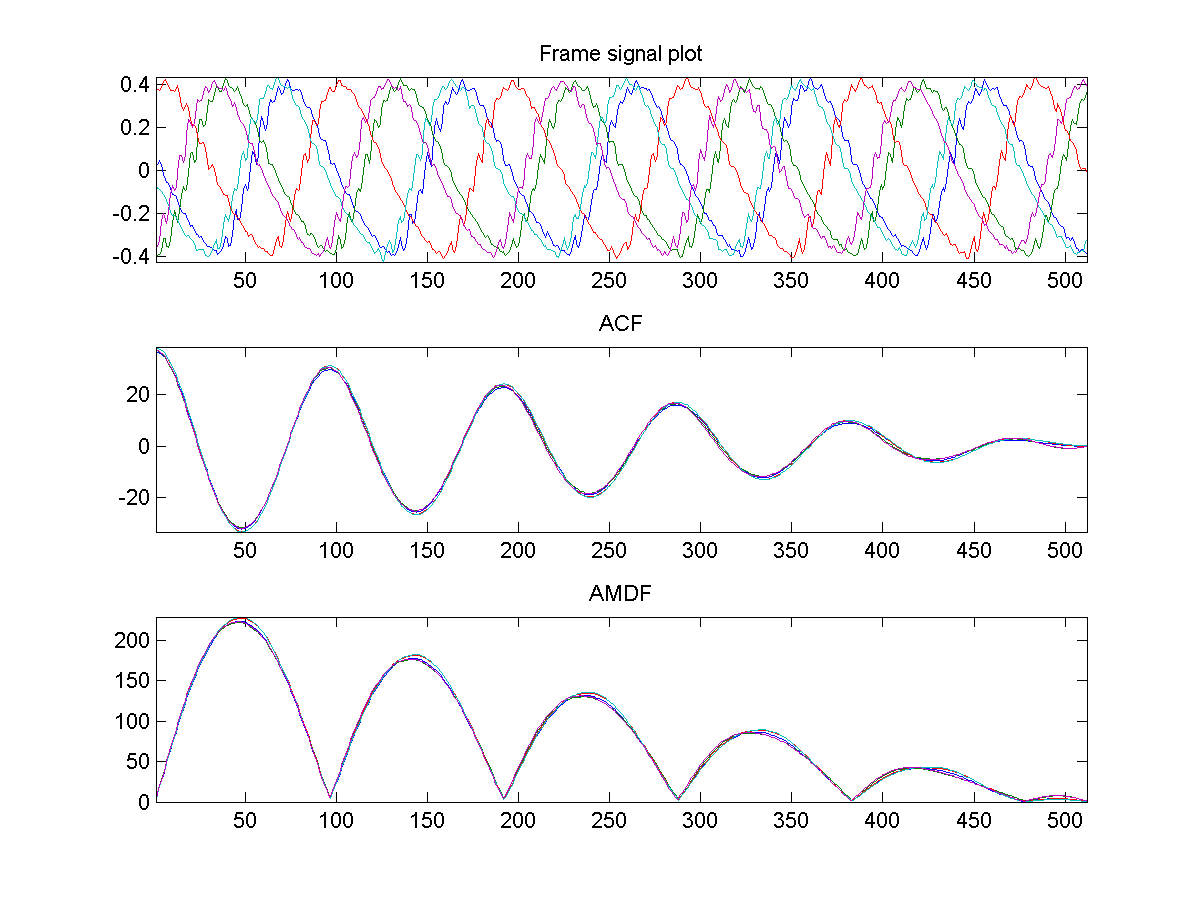
ACF/AMDF of vowel of constant pitch:
Repeat the first exercise using ACF & AMDF as the features. You plots should be similar to the following:
- (***)
Use spectrum for classifying vowels:
Write an m-file script to do the following tasks:
- Record a 5-second clips of the Chinese vowel 「ㄚ、ㄧ、ㄨ、ㄝ、ㄛ」 or the English vowels "a, e, i, o, u") with 16KHz/16Bits/Mono. (Please try to maintain a stable pitch and volume, and keep a short pause between vowels to facilitate automatic vowel segmentation. Here is a sample file for your reference.)
- Use
epdByVol.m(in SAP Toolbox) to detect the starting and ending positions of these 5 vowels. If the segmentation is correct, you should have 5 sound segments from the 3rd output argument ofepdByVol.m. Moreover, you should set plotOpt=1 to verify the segmentation result. Your plot should be similar to the following: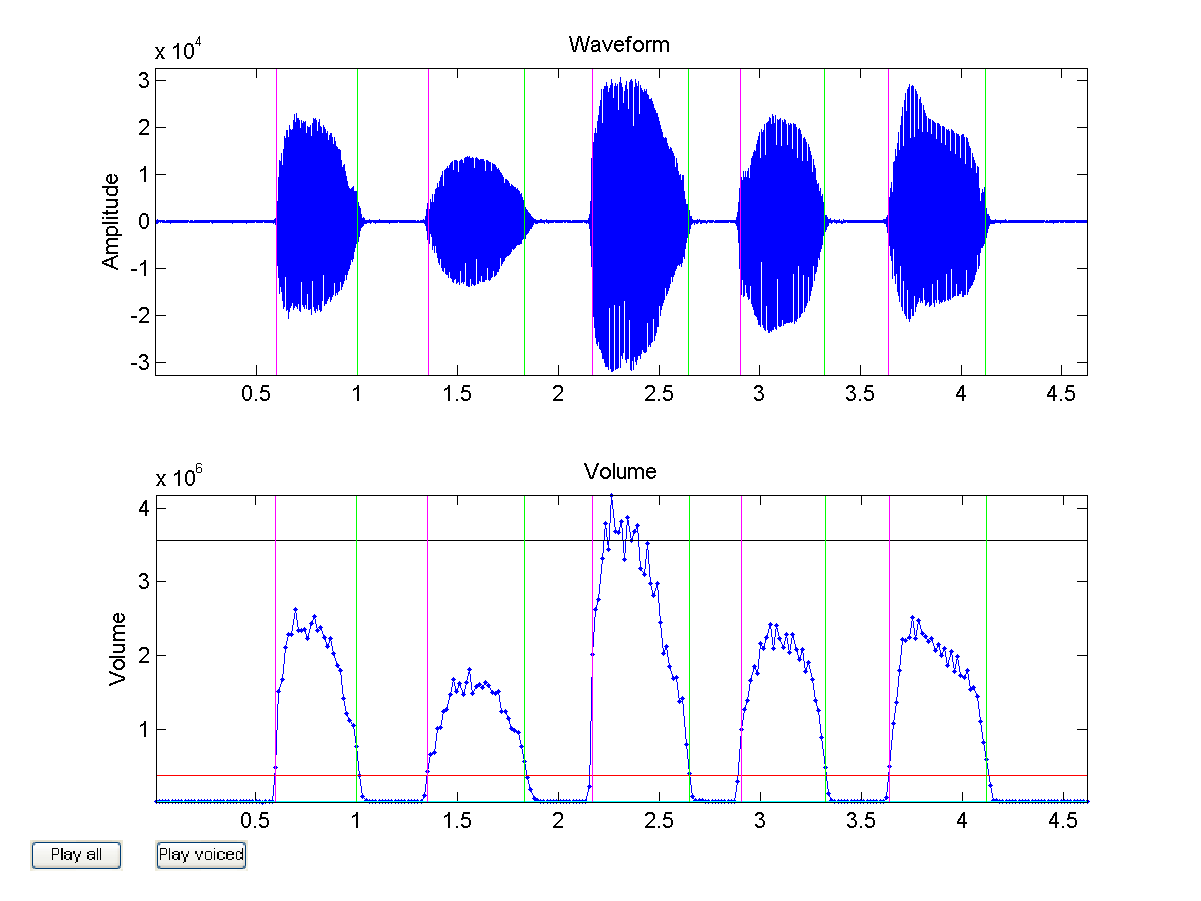
epdByVol.muntil you get the correct segmentation. - Use buffer2.m to do frame blocking on these 5 vowels, with frameSize=32ms and overlap=0ms. Please plot 5 plots of one-sided magnitude spectra (use
fftOneSide.m) corresponding to each vowel. Each plot should contains as many curves of magnitude spectra as the number of frames in this vowel. Your plots should be similar to those shown below: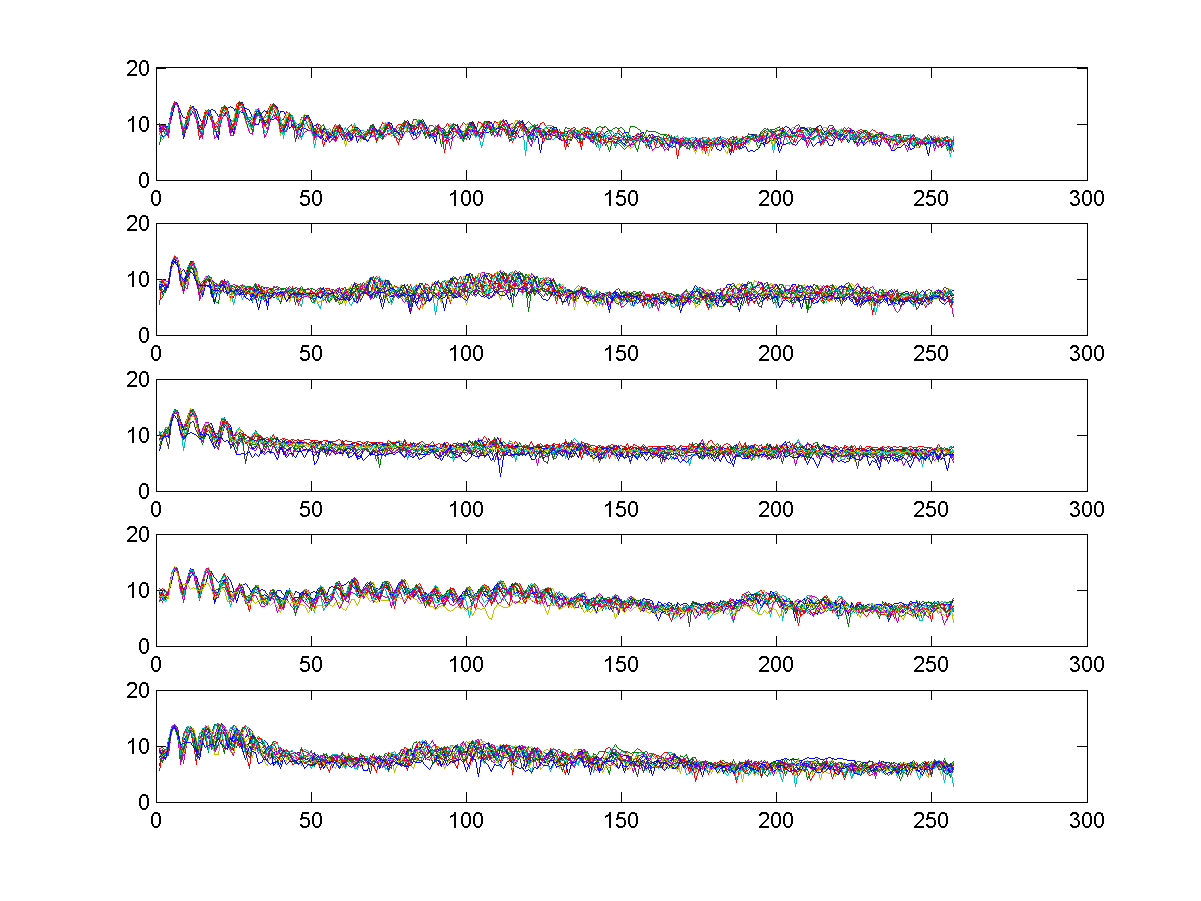
- Use
knncLoo.m(in Machine Learning Toolbox) to compute the leave-one-our recognition rate when we use the one-side magnitude spectrum to classify each frame into 5 classes of different vowels. In particular, we need to change the dimension of the feature from 1 to 257 and plot the leave-one-out recognition rates using KNNC with k=1. What is the maximum recognition rate? What is the corresponding optimum dimension? Your plot should be similar to the next one: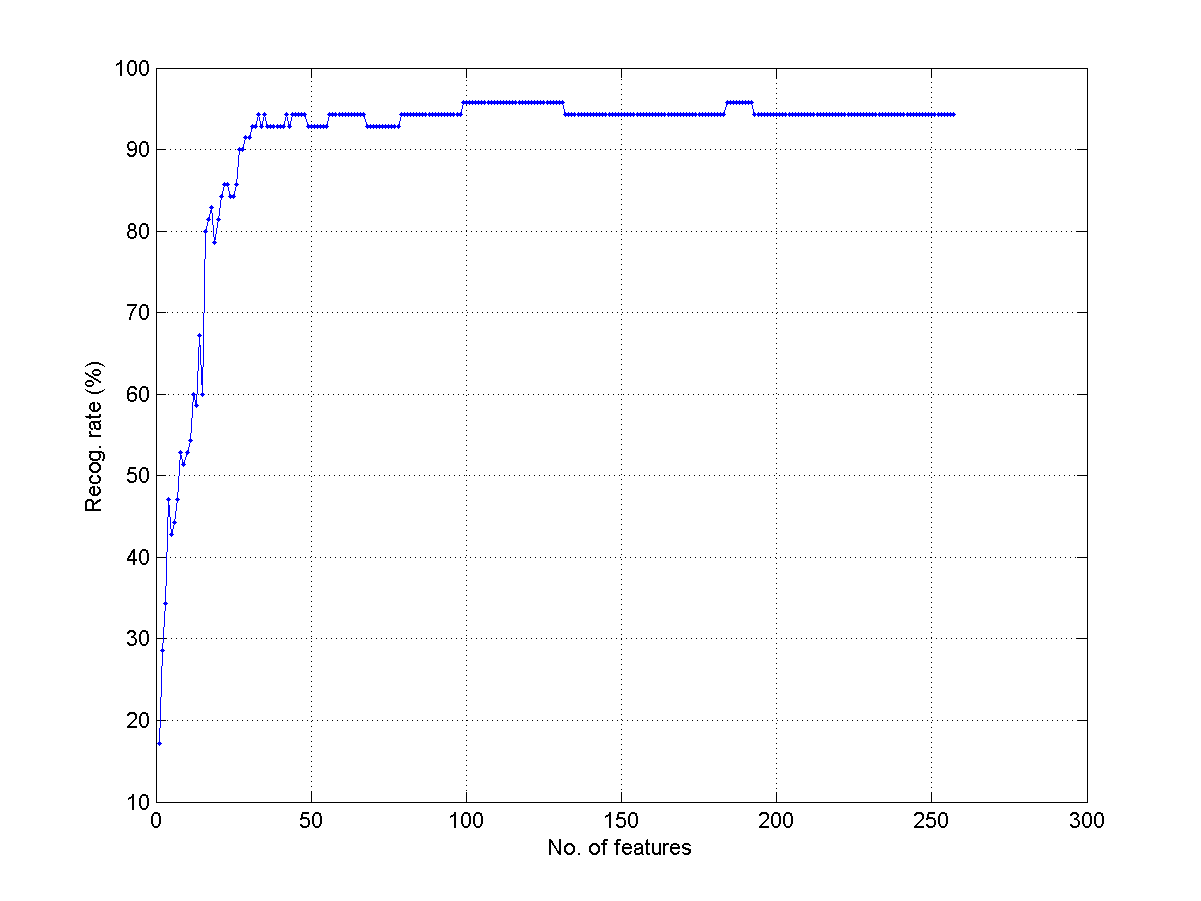
- Record another clip of the same utterance and use it as the test data. Use the original clip as the train data. Use the optimum dimension in the previous subproblem to compute the the frame-based recognition rate of KNNC with k=1. What is the frame-based recognition rate? Plot the confusion matrix, which should be similar to the following figure:
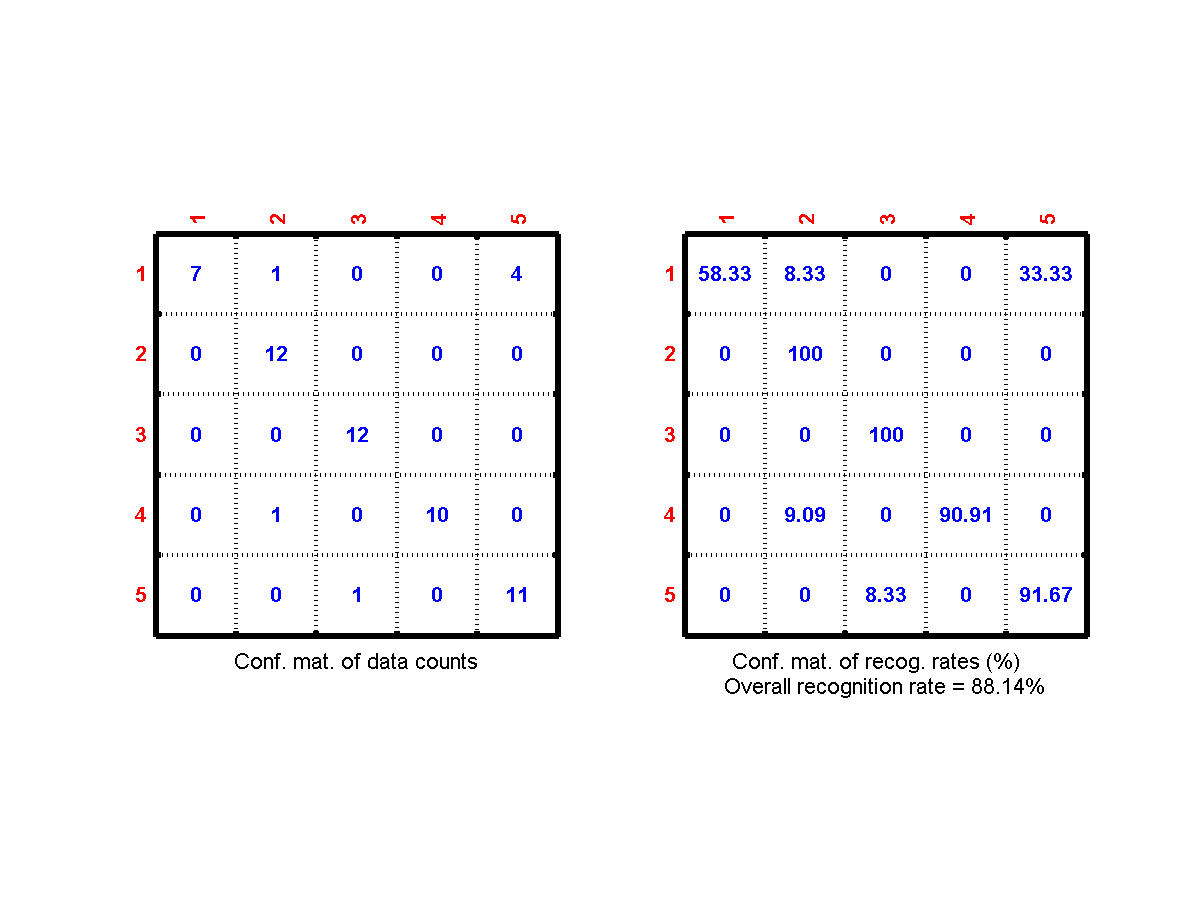
confMatPlot.min the Machine Learning toolbox to plot the confusion matrix.) - What is the vowel-based recognition rate? Plot the confusion matrix, which should be similar to the following figure:
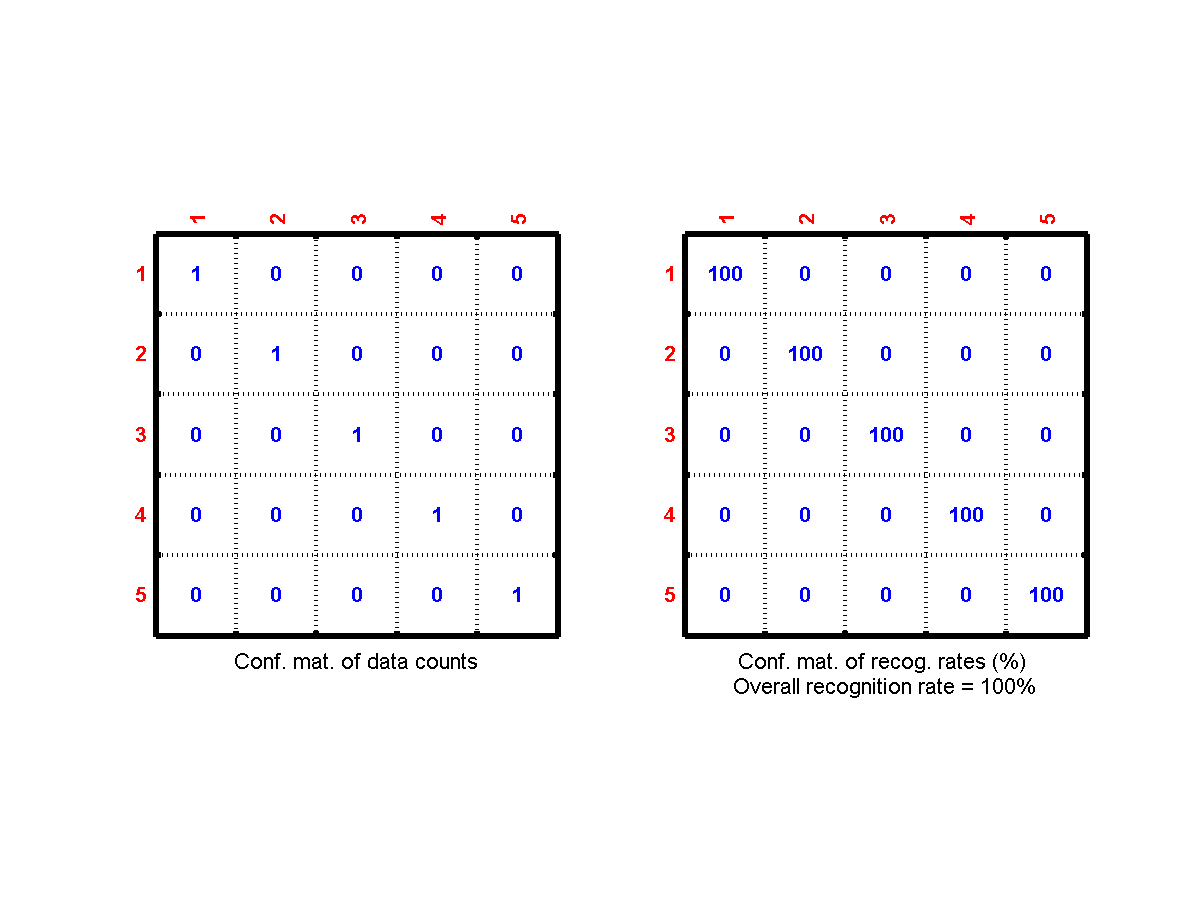
modeto compute the result of voting.)
- (***) Use ACF for classifying vowels: Repeat the previous exercise by using ACF as the acoustic features. Does it perform better than magnitude spectrum? (Hint: Some sort of ACF normalization will make the recognition better.)
- (***) Use AMDF for classifying vowels: Repeat the previous exercise by using AMDF as the acoustic features. Does it perform better than magnitude spectrum? (Hint: Some sort of AMDF normalization will make the recognition better.)
Audio Signal Processing and Recognition (音訊處理與辨識)
